
Stocks & Financial News
Breaking financial news 24/7 courtesy of TradingCharts.com Inc. / TFC Commodity Charts
Discipline and Rules-Based Execution in DRD Response
Key findings for Drdgold Limited American Depositary Shares (NYSE: DRD)
- If Near and Mid-Term Strong Sentiment Holds, It Could Extend to Long Term
- A mid-channel oscillation pattern is in play.
- Exceptional 108.2:1 risk-reward setup targets 30.8% gain vs 0.3% risk
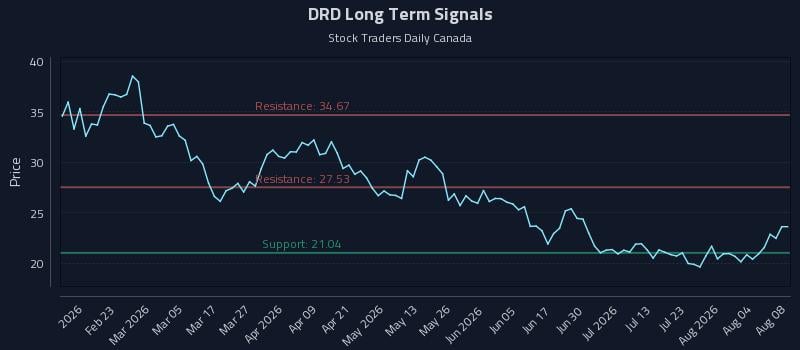
- Signals: 21.04 -- 23.63 -- 27.53 -- 34.67 (bold = current price)
- Positive Sentiment is prevailing thus far -- See current SIGNALS for positioning and risk parameters.
Institutional Trading Strategies
Our AI models have generated three distinct trading strategies tailored to different risk profiles and holding periods. Each strategy incorporates sophisticated risk management parameters designed to optimize position sizing and minimize drawdown risk.
Multi-Timeframe Signal Analysis
| Time Horizon | Signal Strength | Support Signal | Resistance Signal |
|---|---|---|---|
| Near-term (1-5 days) | Strong | $23.47 | $24.35 |
| Mid-term (5-20 days) | Strong | $21.92 | $23.53 |
| Long-term (20+ days) | Neutral | $27.53 | $34.67 |
Technical Analysis
Longer Term Trading Plans for DRD
- Buy DRD near 21.04 target 27.53 stop loss @ 20.98 Details
- Short DRD slightly under 27.53, target 21.04, stop loss @ 27.61 Details
The technical summary data tells us to buy DRD near 21.04 with an upside target of 27.53. This data also tells us to set a stop loss @ 20.98 to protect against excessive loss in case the stock begins to move against the trade. 21.04 is the first level of support below 23.63 , and by rule, any test of support is a buy signal. In this case, support 21.04 would be being tested, so a buy signal would exist.
The technical summary data is suggesting a short of DRD as it gets near 27.53 with a downside target of 21.04. We should have a stop loss in place at 27.61though. 27.53 is the first level of resistance above 23.63, and by rule, any test of resistance is a short signal. In this case, if resistance 27.53 is being tested, so a short signal would exist.
Swing Trading Plans for DRD
- Buy DRD slightly over 27.53, target 34.67, Stop Loss @ 27.45 Details
- Short DRD slightly near 27.53, target 23.53, Stop Loss @ 27.61. Details
If 27.53 begins to break higher, the technical summary data tells us to buy DRD just over 27.53, with an upside target of 34.67. The data also tells us to set a stop loss @ 27.45 in case the stock turns against the trade. 27.53 is the first level of resistance above 23.63, and by rule, any break above resistance is a buy signal. In this case, 27.53, initial resistance, would be breaking higher, so a buy signal would exist. Because this plan is based on a break of resistance, it is referred to as a Long Resistance Plan.
The technical summary data is suggesting a short of DRD if it tests 27.53 with a downside target of 23.53. We should have a stop loss in place at 27.61 though in case the stock begins to move against the trade. By rule, any test of resistance is a short signal. In this case, if resistance, 27.53, is being tested a short signal would exist. Because this plan is a short plan based on a test of resistance it is referred to as a Short Resistance Plan.
Day Trading Plans for DRD
- Buy DRD slightly over 24.35, target 27.53, Stop Loss @ 24.29 Details
- Short DRD slightly near 24.35, target 23.53, Stop Loss @ 24.41. Details
If 24.35 begins to break higher, the technical summary data tells us to buy DRD just over 24.35, with an upside target of 27.53. The data also tells us to set a stop loss @ 24.29 in case the stock turns against the trade. 24.35 is the first level of resistance above 23.63, and by rule, any break above resistance is a buy signal. In this case, 24.35, initial resistance, would be breaking higher, so a buy signal would exist. Because this plan is based on a break of resistance, it is referred to as a Long Resistance Plan.
The technical summary data is suggesting a short of DRD if it tests 24.35 with a downside target of 23.53. We should have a stop loss in place at 24.41 though in case the stock begins to move against the trade. By rule, any test of resistance is a short signal. In this case, if resistance, 24.35, is being tested a short signal would exist. Because this plan is a short plan based on a test of resistance it is referred to as a Short Resistance Plan.
DRD Technical Summary | Raw Data for the Trading Plans
| Term → | Near | Mid | Long |
|---|---|---|---|
| Bias | Strong | Strong | Neutral |
| P1 | 0 | 0 | 21.04 |
| P2 | 23.47 | 21.92 | 27.53 |
| P3 | 24.35 | 23.53 | 34.67 |
COMTEX_490378890/2570/2026-08-09T23:51:04