
Stocks & Financial News
Breaking financial news 24/7 courtesy of TradingCharts.com Inc. / TFC Commodity Charts
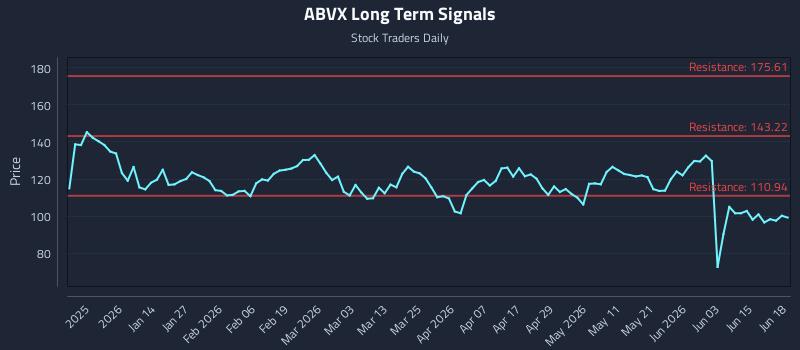
Trading the Move, Not the Narrative: (ABVX) Edition
Key findings for Abivax Sa (NASDAQ: ABVX)
- Divergent Sentiment Across All Horizons Suggests Choppy Conditions
- No clear price positioning signal identified.
- Elevated downside risk as no additional long-term support signals remain.
- Signals: 99.15 -- 106.01 -- 137.46 -- 169.23 (bold = current price)
- Divergent Sentiment Across Horizons Suggests Choppy Conditions -- See current SIGNALS for positioning and risk parameters.
Institutional Trading Strategies
Our AI models have generated three distinct trading strategies tailored to different risk profiles and holding periods. Each strategy incorporates sophisticated risk management parameters designed to optimize position sizing and minimize drawdown risk.
Multi-Timeframe Signal Analysis
| Time Horizon | Signal Strength | Support Signal | Resistance Signal |
|---|---|---|---|
| Near-term (1-5 days) | Neutral | $98.48 | $102.54 |
| Mid-term (5-20 days) | Weak | $97.12 | $111.19 |
| Long-term (20+ days) | Strong | $137.46 | $169.23 |
Technical Analysis
Longer Term Trading Plans for ABVX
- NONE. Details
- Short ABVX slightly under 106.01, target n/a, stop loss @ 106.32 Details
There is no current Support Plan to trigger a buy of this stock at this time. This usually means that there are no clear support levels at this time, so buying the stock as it falls could be considered catching a falling knife. Buy signals only exist if resistance breaks higher.
This often is a signal that the stock you are watching is weak. Waiting for a turn higher may be more intelligent than trying to catch a falling knife. In any case, new support levels are usually revised to the database at the beginning of the next trading session.
The technical summary data is suggesting a short of ABVX as it gets near 106.01, but the downside target is not available from the current data. This tells us to hold that position if it is triggered until a new downside target has been established (updates occur at the beginning of every trading session) or until the position has been stopped. The summary data tells us to have a stop loss in place at 106.32. 106.01 is the first level of resistance above 99.15, and by rule, any test of resistance is a short signal. In this case, if resistance 106.01 is being tested, so a short signal would exist.
Swing Trading Plans for ABVX
- Buy ABVX slightly over 106.01, target 111.19, Stop Loss @ 105.7 Details
- Short ABVX slightly near 106.01, target 97.12, Stop Loss @ 106.32. Details
If 106.01 begins to break higher, the technical summary data tells us to buy ABVX just over 106.01, with an upside target of 111.19. The data also tells us to set a stop loss @ 105.7 in case the stock turns against the trade. 106.01 is the first level of resistance above 99.15, and by rule, any break above resistance is a buy signal. In this case, 106.01, initial resistance, would be breaking higher, so a buy signal would exist. Because this plan is based on a break of resistance, it is referred to as a Long Resistance Plan.
The technical summary data is suggesting a short of ABVX if it tests 106.01 with a downside target of 97.12. We should have a stop loss in place at 106.32 though in case the stock begins to move against the trade. By rule, any test of resistance is a short signal. In this case, if resistance, 106.01, is being tested a short signal would exist. Because this plan is a short plan based on a test of resistance it is referred to as a Short Resistance Plan.
Day Trading Plans for ABVX
- Buy ABVX slightly over 102.54, target 106.01, Stop Loss @ 102.3 Details
- Short ABVX slightly near 102.54, target 98.48, Stop Loss @ 102.78. Details
If 102.54 begins to break higher, the technical summary data tells us to buy ABVX just over 102.54, with an upside target of 106.01. The data also tells us to set a stop loss @ 102.3 in case the stock turns against the trade. 102.54 is the first level of resistance above 99.15, and by rule, any break above resistance is a buy signal. In this case, 102.54, initial resistance, would be breaking higher, so a buy signal would exist. Because this plan is based on a break of resistance, it is referred to as a Long Resistance Plan.
The technical summary data is suggesting a short of ABVX if it tests 102.54 with a downside target of 98.48. We should have a stop loss in place at 102.78 though in case the stock begins to move against the trade. By rule, any test of resistance is a short signal. In this case, if resistance, 102.54, is being tested a short signal would exist. Because this plan is a short plan based on a test of resistance it is referred to as a Short Resistance Plan.
ABVX Technical Summary | Raw Data for the Trading Plans
| Term → | Near | Mid | Long |
|---|---|---|---|
| Bias | Neutral | Weak | Strong |
| P1 | 0 | 0 | 106.01 |
| P2 | 98.48 | 97.12 | 137.46 |
| P3 | 102.54 | 111.19 | 169.23 |
COMTEX_484347882/2570/2026-06-20T06:26:41