
Stocks & Financial News
Breaking financial news 24/7 courtesy of TradingCharts.com Inc. / TFC Commodity Charts
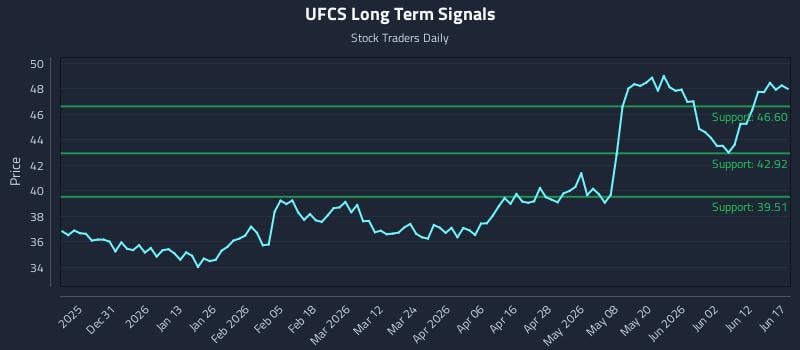
Understanding the Setup: (UFCS) and Scalable Risk
Key findings for United Fire Group Inc (NASDAQ: UFCS)
- Strong Sentiment Across All Horizons Supports Overweight Bias
- No clear price positioning signal identified.
- No resistance levels remain above current price -- compelling upside potential.
- Signals: 40.78 -- 44.27 -- 47.99 -- 48.06(bold = current price)
- Strong Sentiment Across All Horizons Supports Overweight Bias -- See current SIGNALS for positioning and risk parameters.
Institutional Trading Strategies
Our AI models have generated three distinct trading strategies tailored to different risk profiles and holding periods. Each strategy incorporates sophisticated risk management parameters designed to optimize position sizing and minimize drawdown risk.
Multi-Timeframe Signal Analysis
| Time Horizon | Signal Strength | Support Signal | Resistance Signal |
|---|---|---|---|
| Near-term (1-5 days) | Strong | $47.86 | $48.36 |
| Mid-term (5-20 days) | Strong | $48.54 | $50.33 |
| Long-term (20+ days) | Strong | $44.27 | $47.99 |
Technical Analysis
Longer Term Trading Plans for UFCS
- Buy UFCS near 47.99 target n/a stop loss @ 47.85. Details
- NONE . Details
The technical summary data tells us to buy UFCS near 47.99, but there is no current upside target from the summary table. In this case we should wait until either an update to the summary table has been made (which usually happens at the beginning of every trading day), or until the position has been stopped. The data does tell us to set a stop loss 47.85 to protect against excessive loss in case the stock begins to move against the trade. 47.99 is the first level of support below 48.055, and by rule, any test of support is a buy signal. In this case, if support 47.99 is being tested, a buy signal would exist.
NONE .
There are no current resistance levels from the summary table, and therefore there are no Short resistance Plans which tell us to short upon tests of resistance. Resistance levels have broken higher and unless the stock reverses lower and below support levels again short positions look risky.
Swing Trading Plans for UFCS
- Buy UFCS slightly over 48.54, target 50.33, Stop Loss @ 48.4 Details
- Short UFCS slightly near 48.54, target 47.99, Stop Loss @ 48.68. Details
If 48.54 begins to break higher, the technical summary data tells us to buy UFCS just over 48.54, with an upside target of 50.33. The data also tells us to set a stop loss @ 48.4 in case the stock turns against the trade. 48.54 is the first level of resistance above 48.055, and by rule, any break above resistance is a buy signal. In this case, 48.54, initial resistance, would be breaking higher, so a buy signal would exist. Because this plan is based on a break of resistance, it is referred to as a Long Resistance Plan.
The technical summary data is suggesting a short of UFCS if it tests 48.54 with a downside target of 47.99. We should have a stop loss in place at 48.68 though in case the stock begins to move against the trade. By rule, any test of resistance is a short signal. In this case, if resistance, 48.54, is being tested a short signal would exist. Because this plan is a short plan based on a test of resistance it is referred to as a Short Resistance Plan.
Day Trading Plans for UFCS
- Buy UFCS slightly over 48.54, target 50.33, Stop Loss @ 48.43 Details
- Short UFCS slightly near 48.54, target 47.99, Stop Loss @ 48.65. Details
If 48.54 begins to break higher, the technical summary data tells us to buy UFCS just over 48.54, with an upside target of 50.33. The data also tells us to set a stop loss @ 48.43 in case the stock turns against the trade. 48.54 is the first level of resistance above 48.055, and by rule, any break above resistance is a buy signal. In this case, 48.54, initial resistance, would be breaking higher, so a buy signal would exist. Because this plan is based on a break of resistance, it is referred to as a Long Resistance Plan.
The technical summary data is suggesting a short of UFCS if it tests 48.54 with a downside target of 47.99. We should have a stop loss in place at 48.65 though in case the stock begins to move against the trade. By rule, any test of resistance is a short signal. In this case, if resistance, 48.54, is being tested a short signal would exist. Because this plan is a short plan based on a test of resistance it is referred to as a Short Resistance Plan.
UFCS Technical Summary | Raw Data for the Trading Plans
| Term → | Near | Mid | Long |
|---|---|---|---|
| Bias | Strong | Strong | Strong |
| P1 | 0 | 0 | 40.78 |
| P2 | 47.86 | 48.54 | 44.27 |
| P3 | 48.36 | 50.33 | 47.99 |
COMTEX_484121575/2570/2026-06-18T10:12:53